 Manual for AIMAll (Version 14.11.23)
Tutorial 2 - Electron Density Critical Points and Special GradRho Paths
In this tutorial, we will do a basic QTAIM computational analysis and introductory visual QTAIM analysis of tetrahedrane.wfx, a Hartree-Fock 6-311G**
wavefunction file for Tetrahedrane. Tetrahedrane is one of the simplest molecules whose electron density distribution exhibits all 4 types of stable critical points.
- Launch AIMStudio
 from the desktop or quicklaunch area.

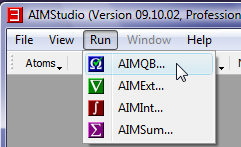
- Select the "Run->AIMQB" menu item to launch an AIMQB Dialog.
- In the AIMQB Dialog, make sure the "Write Molecular Graph" box is checked at the bottom of the dialog and using the "Browse" button
navigate to the folder C:\AIMAll\test\tetrahedrane (on Mac OS X the directory would be, for example, ~/AIMAll/test/tetrahedrane).
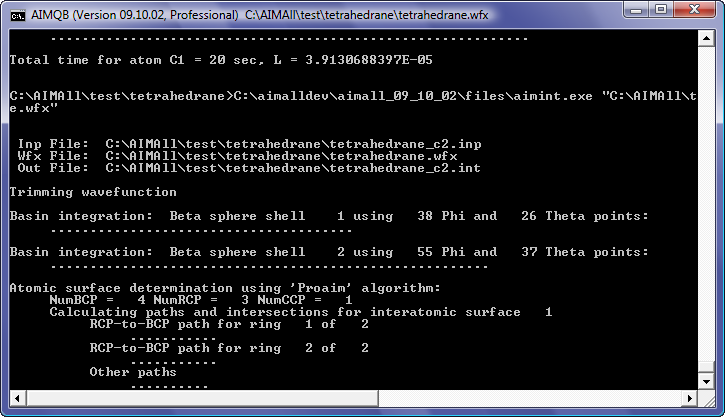
- Select the file tetrahedrane.wfx and then click the "OK" button in the AIMQB dialog to start an AIMAll numerical analysis of tetrahedrane.wfx
- Wait a minute or two until the AIMQB log window indicates that AIMExt is done and that the atomic integrations via AIMInt have begun.
- Select the "File->Open in New Window" menu item and open the file tetrahedrane.mgpviz. A .mgpviz is a subset of a corresponding .sumviz file. A .mgpviz file is produced earlier than a .sumviz file
and contains mostly information about the molecular graph, i.e., the electron density critical points and the special GradRho paths connecting them.
- Uncheck the menu item "Atoms->Names->Show Names" and check the menu item "Atoms->Nuclear Style->Medium Spheres".
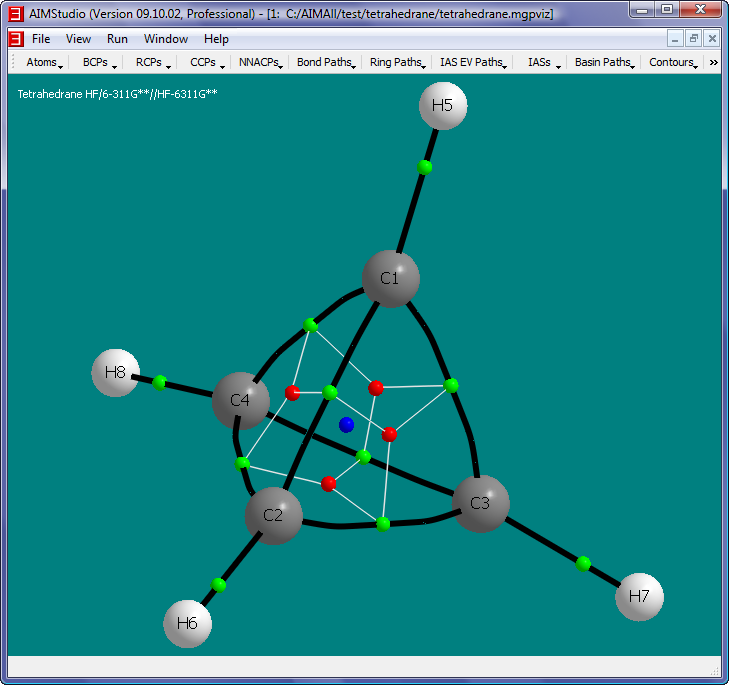
The objects in this picture are:
- White spheres: Hydrogen nuclei
- Gray spheres: Carbon nuclei
- Green spheres: Bond Critical Points (BCPs).
- Red spheres: Ring Critical Points (RCPs).
- Blue sphere: Cage Critical Point (CCP).
- Black paths: Bond Paths, i.e., pairs of GradRho paths which originate at BCPs and terminate at nuclei (Nuclear Attractor Critical Points actually). Each BCP has a pair of GradRho paths which together define the Bond Path. Note that the C-C Bond
Paths are significantly "bent", which is consistent with the notion of severe "bond strain" associated with Tetrahedrane.
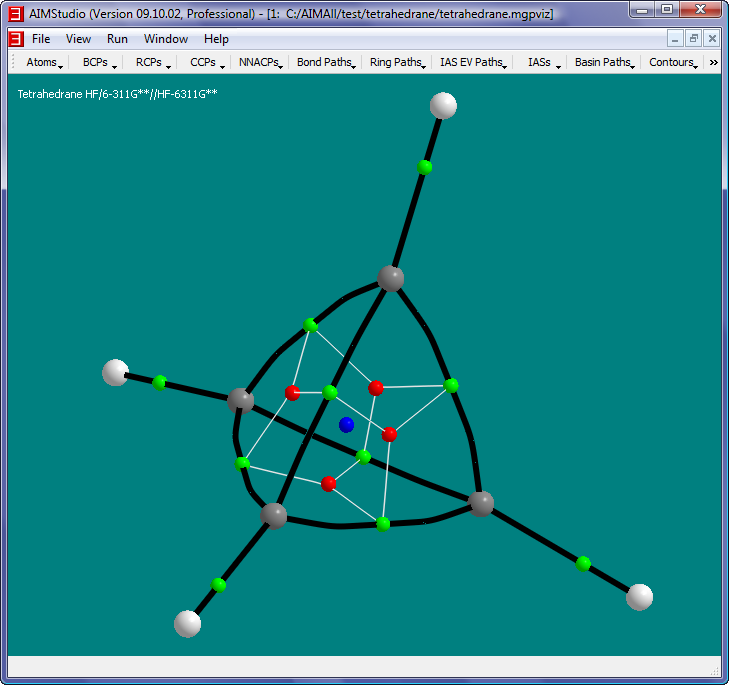
- White paths: RCP-to-BCP Ring Paths, i.e., GradRho paths which originate at RCPs and terminate at BCPs.
- Uncheck the menu item "Ring Paths->RCP-to-BCP Paths->Show RCP-to-BCP Paths" and check the menu item "Ring Paths->RCP Attractor Paths->Show RCP Attractor Paths".
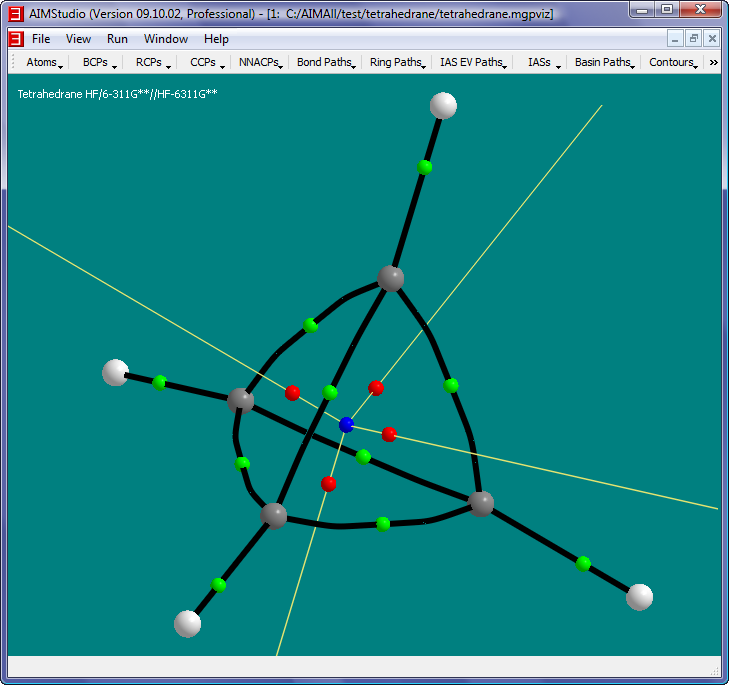
The yellow paths in this picture are RCP Attractor Paths, i.e., GradRho paths that terminate at RCPs. Each RCP has a pair of RCP Attractor Paths. In this case, one
of each pair originates at the CCP while the other originates at infinity.
- Uncheck the menu item "Ring Paths->RCP Attractor Paths->Show RCP Attractor Paths" and check the menu item "IAS EV Paths->Show IAS EV Paths"
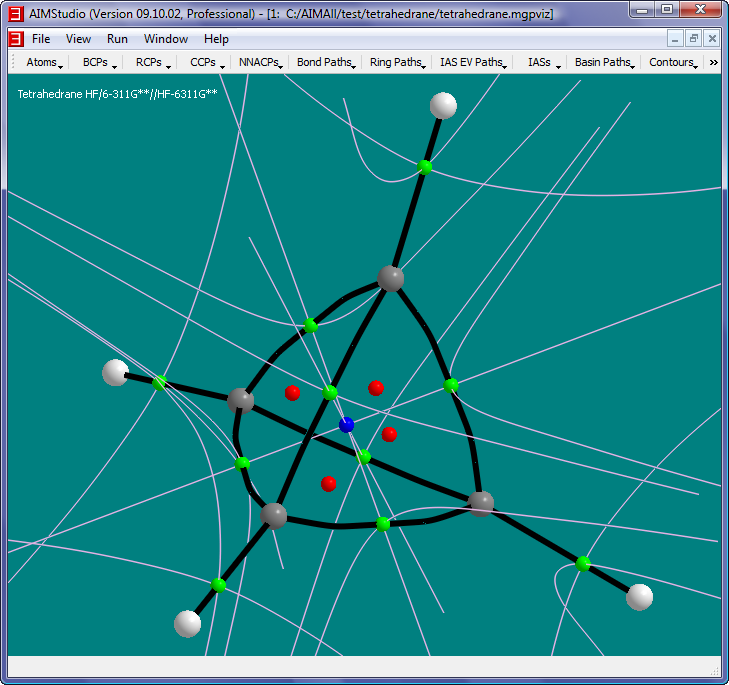
The pink paths in this picture are IAS EV Paths (InterAtomic Surface EigenVector Paths), i.e., GradRho paths that terminate at BCPs and which are locally parallel or anti-parallel
with the two negative-eigenvalued eigenvectors of the Hessian of Rho (HessRho) in the neighborhood of the BCPs. There are 4 IAS EV paths per BCP, 2 for each negative-eigenvalued eigenvector of HessRho.
The IAS EV Paths can give a rough idea of the shapes of interatomic surfaces.
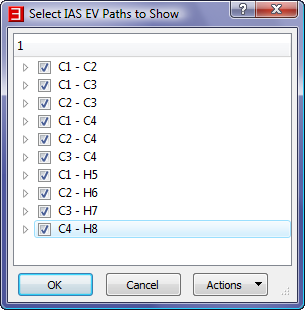
- Select the menu item "IAS EV Paths->IAS EV Paths to Show" to launch a dialog entitled "Select Which IAS EV Paths to Show" In this
dialog, uncheck all boxes except "C1 - H5" in order to only show the IAS EV Paths for the C1-H5 BCP.
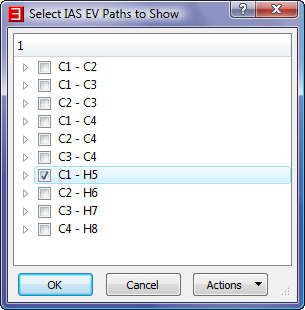
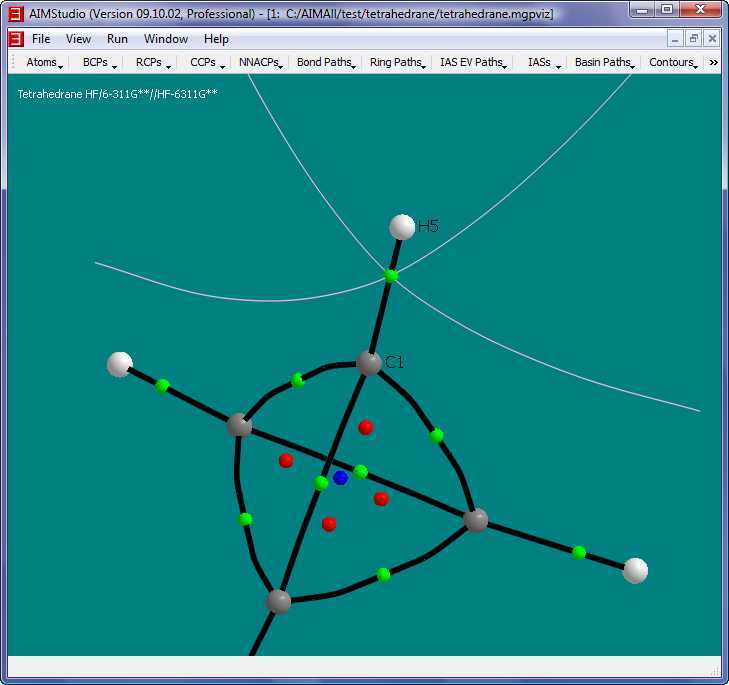
Note that in this picture atom name labels for just the C1 and H5 atoms are shown, and they are shown to the right of the nuclear spheres. This was achieved by checking the "Atoms->Names->Show Names" menu item
as well as the "Atoms->Names->Mode->Selected Atoms" menu item and the "Atoms->Names->Placement->Right" menu item, followed by clicking on the C1 and H5 nuclear spheres.
- One way to quantify the notion of "bond strain" is to compare a Bond Path Length (BPL) with a corresponding Geometric Bond Length (GBL_I, the Euclidean distance between nuclear attractors connected by a Bond Path)). Check the menu
item "BCPs->Properties->Length->BPL - GBL_I" to show the difference between the BPL and GBL_I for each Bond Path. To show the values for just
one C-C Bond Path and one C-H bond path, you can check the "BCPs->Properties->Mode->Selected BCPs" menu item, followed by selecting one of the C-C BCP spheres
and one of the C-H BCP spheres.

Note that the value of BPL-GBL_I is significantly positive (0.033 a.u.) for a C-C bond path but is zero for a C-H bond path (by symmetry alone in this case). In an unstrained hydrocarbon molecule
BPL-GBL_I would be zero or nearly zero for the C-C bond paths.
Copyright © by Todd A. Keith, 1997-2014 (aim@tkgristmill.com)