| viridis {viridisLite} | R Documentation |
This function creates a vector of n equally spaced colors along the
Matplolib 'viridis' color map created by Stéfan van der Walt
and Nathaniel Smith. This color map is
designed in such a way that it will analytically be perfectly perceptually-uniform,
both in regular form and also when converted to black-and-white. It is also
designed to be perceived by readers with the most common form of color blindness.
viridis(n, alpha = 1, begin = 0, end = 1, direction = 1, option = "D")

viridisMap(n = 256, alpha = 1, begin = 0, end = 1, direction = 1,
  option = "D")

magma(n, alpha = 1, begin = 0, end = 1, direction = 1)

inferno(n, alpha = 1, begin = 0, end = 1, direction = 1)

plasma(n, alpha = 1, begin = 0, end = 1, direction = 1)
n |
The number of colors (≥ 1) to be in the palette. |
alpha |
The alpha transparency, a number in [0,1], see argument alpha in
|
begin |
The (corrected) hue in [0,1] at which the viridis colormap begins. |
end |
The (corrected) hue in [0,1] at which the viridis colormap ends. |
direction |
Sets the order of colors in the scale. If 1, the default, colors are ordered from darkest to lightest. If -1, the order of colors is reversed. |
option |
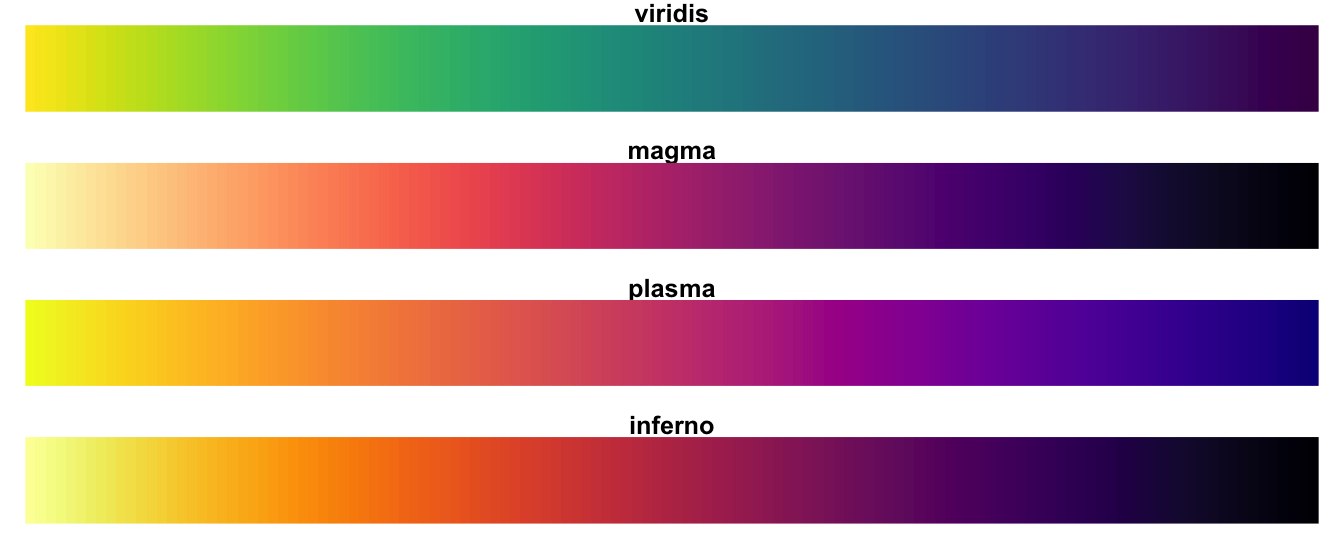
A character string indicating the colormap option to use. Four options are available: "magma" (or "A"), "inferno" (or "B"), "plasma" (or "C"), and "viridis" (or "D", the default option). |
Here are the color scales:
magma(), plasma(), and inferno() are convenience
functions for the other colormap options, which are useful the scale must
be passed as a function name.
Semi-transparent colors (0 < alpha < 1) are supported only on some
devices: see rgb.
viridis returns a character vector, cv, of color hex
codes. This can be used either to create a user-defined color palette for
subsequent graphics by palette(cv), a col = specification in
graphics functions or in par.
viridisMap returns a n lines data frame containing the
red (R), green (G), blue (B) and alpha (alpha)
channels of n equally spaced colors along the 'viridis' color map.
n = 256 by default, which corresponds to the data from the original
'viridis' color map in Matplotlib.
Simon Garnier: garnier@njit.edu, @sjmgarnier
library(ggplot2)
library(hexbin)

dat <- data.frame(x = rnorm(10000), y = rnorm(10000))

ggplot(dat, aes(x = x, y = y)) +
  geom_hex() + coord_fixed() +
  scale_fill_gradientn(colours = viridis(256, option = "D"))

# using code from RColorBrewer to demo the palette
n = 200
image(
  1:n, 1, as.matrix(1:n),
  col = viridis(n, option = "D"),
  xlab = "viridis n", ylab = "", xaxt = "n", yaxt = "n", bty = "n"
)