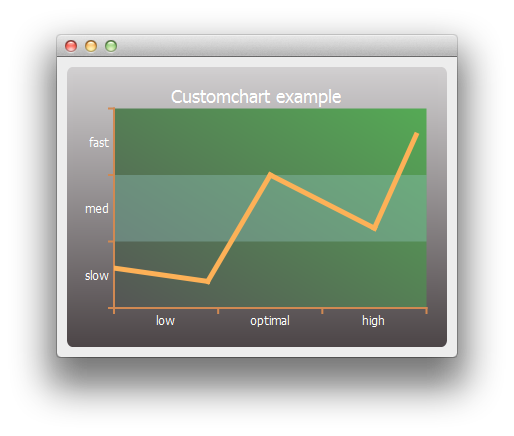
Custom Chart Example
We begin by creating a simple line series and a chart object.
      QLineSeries *series = new QLineSeries();
      *series << QPointF(0, 6) << QPointF(9, 4) << QPointF(15, 20) << QPointF(25, 12) << QPointF(29, 26);
      QChart *chart = new QChart();
      chart->legend()->hide();
      chart->addSeries(series);
First we customize the series and the chart's title and background.
      // Customize series
      QPen pen(QRgb(0xfdb157));
      pen.setWidth(5);
      series->setPen(pen);

      // Customize chart title
      QFont font;
      font.setPixelSize(18);
      chart->setTitleFont(font);
      chart->setTitleBrush(QBrush(Qt::white));
      chart->setTitle("Customchart example");

      // Customize chart background
      QLinearGradient backgroundGradient;
      backgroundGradient.setStart(QPointF(0, 0));
      backgroundGradient.setFinalStop(QPointF(0, 1));
      backgroundGradient.setColorAt(0.0, QRgb(0xd2d0d1));
      backgroundGradient.setColorAt(1.0, QRgb(0x4c4547));
      backgroundGradient.setCoordinateMode(QGradient::ObjectBoundingMode);
      chart->setBackgroundBrush(backgroundGradient);

      // Customize plot area background
      QLinearGradient plotAreaGradient;
      plotAreaGradient.setStart(QPointF(0, 1));
      plotAreaGradient.setFinalStop(QPointF(1, 0));
      plotAreaGradient.setColorAt(0.0, QRgb(0x555555));
      plotAreaGradient.setColorAt(1.0, QRgb(0x55aa55));
      plotAreaGradient.setCoordinateMode(QGradient::ObjectBoundingMode);
      chart->setPlotAreaBackgroundBrush(plotAreaGradient);
      chart->setPlotAreaBackgroundVisible(true);
Then we customize the axes.
      QCategoryAxis *axisX = new QCategoryAxis();
      QCategoryAxis *axisY = new QCategoryAxis();

      // Customize axis label font
      QFont labelsFont;
      labelsFont.setPixelSize(12);
      axisX->setLabelsFont(labelsFont);
      axisY->setLabelsFont(labelsFont);

      // Customize axis colors
      QPen axisPen(QRgb(0xd18952));
      axisPen.setWidth(2);
      axisX->setLinePen(axisPen);
      axisY->setLinePen(axisPen);

      // Customize axis label colors
      QBrush axisBrush(Qt::white);
      axisX->setLabelsBrush(axisBrush);
      axisY->setLabelsBrush(axisBrush);

      // Customize grid lines and shades
      axisX->setGridLineVisible(false);
      axisY->setGridLineVisible(false);
      axisY->setShadesPen(Qt::NoPen);
      axisY->setShadesBrush(QBrush(QColor(0x99, 0xcc, 0xcc, 0x55)));
      axisY->setShadesVisible(true);
Then the axis label values and ranges. Once the axes are ready, we set them to be used by the chart.
      axisX->append("low", 10);
      axisX->append("optimal", 20);
      axisX->append("high", 30);
      axisX->setRange(0, 30);

      axisY->append("slow", 10);
      axisY->append("med", 20);
      axisY->append("fast", 30);
      axisY->setRange(0, 30);

      chart->setAxisX(axisX, series);
      chart->setAxisY(axisY, series);
Finally, we create a view containing the chart.
      QChartView *chartView = new QChartView(chart);
      chartView->setRenderHint(QPainter::Antialiasing);
Now we are ready to show the chart on a main window.
      QMainWindow window;
      window.setCentralWidget(chartView);
      window.resize(400, 300);
      window.show();
Files: