Logarithmic Axis Example
Create a QLineSeries instance and add some data to it.
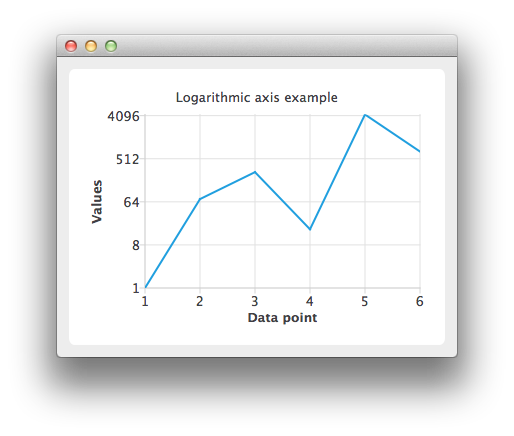
  QLineSeries *series = new QLineSeries();
  *series << QPointF(1, 1) << QPointF(2, 73) << QPointF(3, 268) << QPointF(4, 17) << QPointF(5, 4325) << QPointF(6, 723);
To present the data on the chart we need a QChart instance. Add the series to it, hide the legend and set the title of the chart.
  QChart *chart = new QChart();
  chart->addSeries(series);
  chart->legend()->hide();
  chart->setTitle("Logarithmic axis example");
Create the axes. Add them to the chart and attach to the series.
  QValueAxis *axisX = new QValueAxis;
  axisX->setTitleText("Data point");
  axisX->setTickCount(6);
  axisX->setLabelFormat("%i");
  chart->addAxis(axisX, Qt::AlignBottom);
  series->attachAxis(axisX);

  QLogValueAxis *axisY = new QLogValueAxis;
  axisY->setLabelFormat("%g");
  axisY->setTitleText("Values");
  axisY->setBase(8);
  chart->addAxis(axisY, Qt::AlignLeft);
  series->attachAxis(axisY);
Then create a QChartView object with QChart as a parameter. Enable antialiasing to have the rendered line look nicer.
  QChartView *chartView = new QChartView(chart);
  chartView->setRenderHint(QPainter::Antialiasing);
The chart is ready to be shown.
  QMainWindow window;
  window.setCentralWidget(chartView);
  window.resize(400, 300);
  window.show();
Files: