Qt Quick 2 Spectrogram Example
The Qt Quick 2 Spectrogram example demonstrates how to show a polar and cartesian spectrograms and how to utilize orthographic projection to show them in 2D.
Spectrogram is simply a surface graph with a range gradient used to emphasize the different values. Typically spectrograms are shown with two dimensional surfaces, which we simulate with a top down orthographic view of the graph. To enforce the 2D effect, we disable the graph rotation via mouse or touch when in the orthographic mode.
The focus in this example is on showing how to display spectrograms, so the basic functionality is not explained. For more detailed QML example documentation, see Qt Quick 2 Scatter Example.
Creating a spectrogram
To create a 2D spectrogram, we define a Surface3D item:
  Surface3D {
      id: surfaceGraph
      width: surfaceView.width
      height: surfaceView.height

      shadowQuality: AbstractGraph3D.ShadowQualityNone
      selectionMode: AbstractGraph3D.SelectionSlice | AbstractGraph3D.SelectionItemAndColumn
      axisX: xAxis
      axisY: yAxis
      axisZ: zAxis

      theme: customTheme
      inputHandler: customInputHandler

      // Remove the perspective and view the graph from top down to achieve 2D effect
      orthoProjection: true
      scene.activeCamera.cameraPreset: Camera3D.CameraPresetDirectlyAbove

      flipHorizontalGrid: true

      radialLabelOffset: 0.01

      horizontalAspectRatio: 1
      scene.activeCamera.zoomLevel: 85

      Surface3DSeries {
          id: surfaceSeries
          flatShadingEnabled: false
          drawMode: Surface3DSeries.DrawSurface
          baseGradient: surfaceGradient
          colorStyle: Theme3D.ColorStyleRangeGradient
          itemLabelFormat: "(@xLabel, @zLabel): @yLabel"

          ItemModelSurfaceDataProxy {
              itemModel: surfaceData.model
              rowRole: "radius"
              columnRole: "angle"
              yPosRole: "value"
          }
      }
  }
The key properties for enabling the 2D effect are orthoProjection and scene.activeCamera.cameraPreset. We remove the perspective by enabling orthographic projection for the graph, and then we eliminate the Y-dimension by viewing the graph directly from above:
  orthoProjection: true
  scene.activeCamera.cameraPreset: Camera3D.CameraPresetDirectlyAbove
Since this viewpoint causes the horizontal axis grid to be mostly obscured by the surface, we also specify that the horizontal grid should be drawn on top of the graph:
flipHorizontalGrid: true
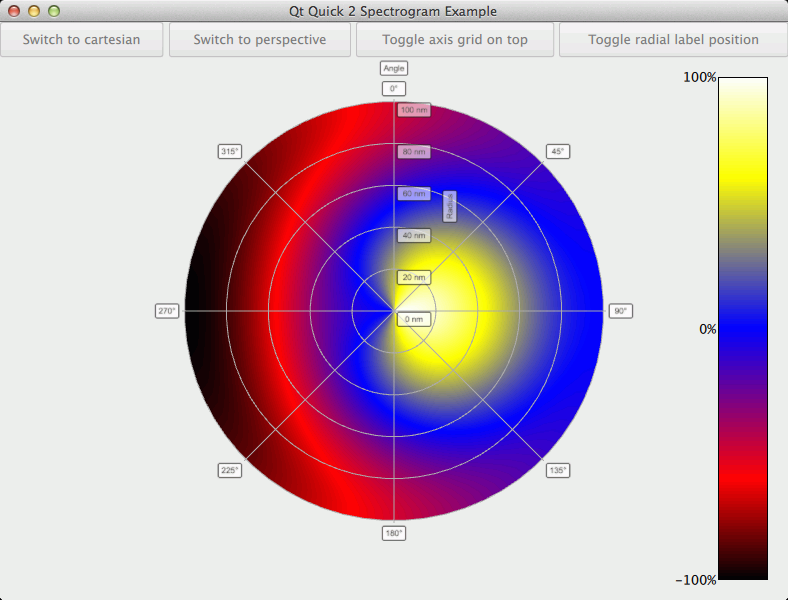
Polar spectrogram
Depending on the data, it is sometimes more natural to use a polar graph instead of a cartesian one. Qt Data Visualization supports this via polar property. In this example we provide a button to switch between polar and cartesian modes:
  NewButton {
      id: polarToggle
      Layout.fillWidth: true
      Layout.fillHeight: true
      text: "Switch to polar"
      onClicked: {
          if (surfaceGraph.polar === false) {
              surfaceGraph.polar = true
              text = "Switch to cartesian"
          } else {
              surfaceGraph.polar = false
              text = "Switch to polar"
          }
      }
  }
In the polar mode, the X-axis is converted into the angular polar axis, and the Z-axis is converted into the radial polar axis. The surface points are recalculated according to new axes.
The radial axis labels are drawn outside the graph by default, but in this example we want to draw them right next to the 0 degree angular axis inside the graph, so we define only a tiny offset for them:
radialLabelOffset: 0.01
To enforce the 2D effect, graph rotation via user input is disabled when in orthographic mode. We do this by specifying a new input handler:
  TouchInputHandler3D {
      id: customInputHandler
      rotationEnabled: false
  }
  Surface3D {
  ...
  inputHandler: customInputHandler
  ...
When the projection mode changes, we adjust the value of the rotationEnabled property of the customInputHandler to control the rotation.
Example contents
Files: