Qt Quick 2 Surface Example
The Qt Quick 2 surface example shows how to make a simple 3D surface plot using Surface3D with Qt Quick 2.
The focus in this example is on generating a surface graph from height data, so in this section we skip explaining the application creation. For more detailed QML example documentation, see Qt Quick 2 Scatter Example.
Adding data to the graph
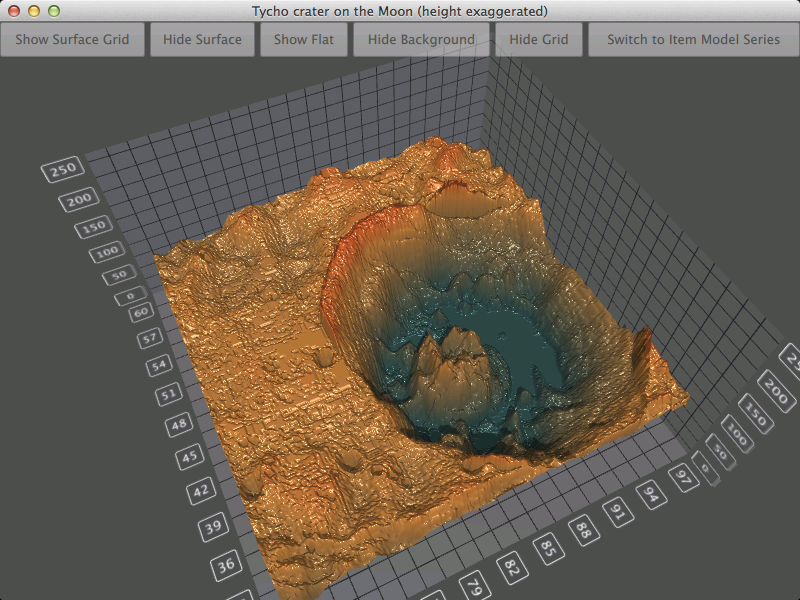
This example shows two methods to set data to surface graph, using the HeightMapSurfaceDataProxy and ItemModelSurfaceDataProxy. First we go through setting the data using the height map specific data proxy. It is done with the code snippet below. The proxy itself is contained in a Surface3DSeries. Inside the HeightMapSurfaceDataProxy the heightMapFile specifies the image file containing the height data. The value properties in the proxy define the minimum and maximum values for surface area width and depth. This example shows the terrain around Tycho crater at imaginary position from 67 to 97 and from 30 to 60. Note that on the graph the scale on the Y dimension exaggerates the height.
  Surface3DSeries {
      id: heightSeries
      flatShadingEnabled: false
      drawMode: Surface3DSeries.DrawSurface
      visible: false

      HeightMapSurfaceDataProxy {
          heightMapFile: ":/heightmaps/image"
          // We don't want the default data values set by heightmap proxy.
          minZValue: 30
          maxZValue: 60
          minXValue: 67
          maxXValue: 97
      }

      onDrawModeChanged: checkState()
  }
The other method to set surface data used in this example is with model mapping. We do that by first defining a ListModel containing the data for the surface:
  ListModel {
      id: dataModel
      ListElement{ longitude: "0"; latitude: "0"; height: "124"; }
      ListElement{ longitude: "0"; latitude: "1"; height: "125"; }
      ListElement{ longitude: "0"; latitude: "2"; height: "124"; }
      ...
Then we set up a Surface3DSeries with a ItemModelSurfaceDataProxy:
  Surface3DSeries {
      id: surfaceSeries
      flatShadingEnabled: false
      drawMode: Surface3DSeries.DrawSurface

      ItemModelSurfaceDataProxy {
      ...
We add the actual data to the itemModel of the ItemModelSurfaceDataProxy. We also define the roles for columns, rows and values. In this example the row holds values for longitude, column for latitude and the value is for height.
  ...
  itemModel: surfaceData.model
  rowRole: "longitude"
  columnRole: "latitude"
  yPosRole: "height"
  }
Showing data
In the main.qml, we set up the Surface3D element to show the data and various UI elements to illustrate few interesting features.
First is the gradient to be used for the surface, which can be defined as seen in the following snippet. With the ColorGradient we set example colors from position 0.0 to 1.0.
  ColorGradient {
      id: surfaceGradient
      ColorGradientStop { position: 0.0; color: "darkslategray" }
      ColorGradientStop { id: middleGradient; position: 0.25; color: "peru" }
      ColorGradientStop { position: 1.0; color: "red" }
  }
This element is set into the baseGradients property in the theme used in Surface3D:
  theme: Theme3D {
      type: Theme3D.ThemeStoneMoss
      font.family: "STCaiyun"
      font.pointSize: 35
      colorStyle: Theme3D.ColorStyleRangeGradient
      baseGradients: [surfaceGradient]
  }
Other interesting features can be controlled with buttons.
The first button is to toggle on and off the surface grid, for which we use the following code:
  onClicked: {
      if (surfaceSeries.drawMode & Surface3DSeries.DrawWireframe) {
          surfaceSeries.drawMode &= ~Surface3DSeries.DrawWireframe;
          heightSeries.drawMode &= ~Surface3DSeries.DrawWireframe;
      } else {
          surfaceSeries.drawMode |= Surface3DSeries.DrawWireframe;
          heightSeries.drawMode |= Surface3DSeries.DrawWireframe;
      }
  }
Second button is for surface shading mode, which is controlled with this code:
  onClicked: {
      if (surfaceSeries.flatShadingEnabled === true) {
          surfaceSeries.flatShadingEnabled = false;
          heightSeries.flatShadingEnabled = false;
          text = "Show Flat"
      } else {
          surfaceSeries.flatShadingEnabled = true;
          heightSeries.flatShadingEnabled = true;
          text = "Show Smooth"
      }
  }
Third button is for series visibility, which is controlled with this code:
  onClicked: {
      if (surfaceSeries.drawMode & Surface3DSeries.DrawSurface) {
          surfaceSeries.drawMode &= ~Surface3DSeries.DrawSurface;
          heightSeries.drawMode &= ~Surface3DSeries.DrawSurface;
      } else {
          surfaceSeries.drawMode |= Surface3DSeries.DrawSurface;
          heightSeries.drawMode |= Surface3DSeries.DrawSurface;
      }
  }
Notice that the drawMode and flatShadingEnable properties are set for both series.
Fourth and fifth buttons are for controlling background features.
The last button is for switching between the two series, one of which uses HeightMapSurfaceDataProxy and the other one ItemModelSurfaceDataProxy. For this we use the following code:
  onClicked: {
      if (surfaceSeries.visible === false) {
          surfacePlot.axisY.max = 500.0
          surfaceSeries.visible = true
          heightSeries.visible = false
          middleGradient.position = 0.25
          text = "Switch to Height Map Series"
      } else {
          surfacePlot.axisY.max = 250.0
          surfaceSeries.visible = false
          heightSeries.visible = true
          middleGradient.position = 0.50
          text = "Switch to Item Model Series"
      }
  }
We also set the maximum value to 500 in model proxy to make the surface flatter and 250 on height map proxy to show exaggerated height. At the same time the middle color position on the gradient is modified to match the value range change.
Example contents
Files: