| System: | deficit-cloaking-device.mit.edu in MIT W20-575A |
| Maintainer: | MIT SIPB, sipb-machine-room@mit.edu, 617.253.7788 |
| Description: | bloom-beacon |
| ifType: | ethernetCsmacd (6) |
| ifName: | |
| Max Speed: | 100.0 Mbits/s |
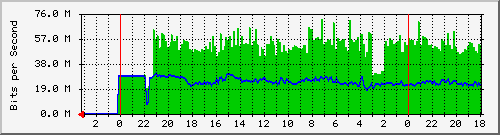
| Max In: | 72.7 Mb/s (72.7%) | Average In: | 51.2 Mb/s (51.2%) | Current In: | 0.0 b/s (0.0%) | ||
| Max Out: | 31.8 Mb/s (31.8%) | Average Out: | 25.1 Mb/s (25.1%) | Current Out: | 0.0 b/s (0.0%) |
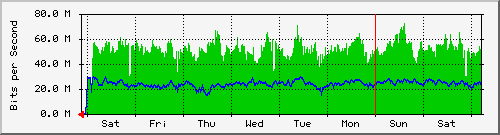
| Max In: | 73.1 Mb/s (73.1%) | Average In: | 52.5 Mb/s (52.5%) | Current In: | 0.0 b/s (0.0%) | ||
| Max Out: | 30.1 Mb/s (30.1%) | Average Out: | 24.4 Mb/s (24.4%) | Current Out: | 0.0 b/s (0.0%) |
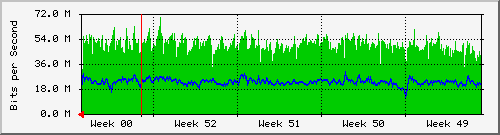
| Max In: | 70.4 Mb/s (70.4%) | Average In: | 50.8 Mb/s (50.8%) | Current In: | 17.4 Mb/s (17.4%) | ||
| Max Out: | 30.9 Mb/s (30.9%) | Average Out: | 23.4 Mb/s (23.4%) | Current Out: | 17.0 Mb/s (17.0%) |
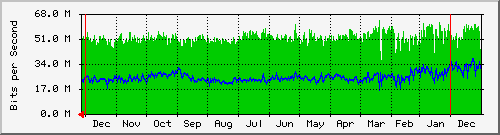
| Max In: | 64.3 Mb/s (64.3%) | Average In: | 53.0 Mb/s (53.0%) | Current In: | 53.5 Mb/s (53.5%) | ||
| Max Out: | 37.9 Mb/s (37.9%) | Average Out: | 25.4 Mb/s (25.4%) | Current Out: | 24.6 Mb/s (24.6%) |
| GREEN ### | Incoming Traffic in Bits per Second |
| BLUE ### | Outgoing Traffic in Bits per Second |
| 2.10.5 | Tobias Oetiker <oetiker@ee.ethz.ch> and Dave Rand <dlr@bungi.com> |