 Manual for AIMAll (Version 14.11.23)
Tutorial 11 - Relief Maps
This tutorial shows some ways to generate and display relief maps using AIMStudio. Like contour maps, relief maps are created from 2D grid data files (*.g2dviz). A relief map
shows the variation in the value of a function in a plane in terms of height above or below the plane.
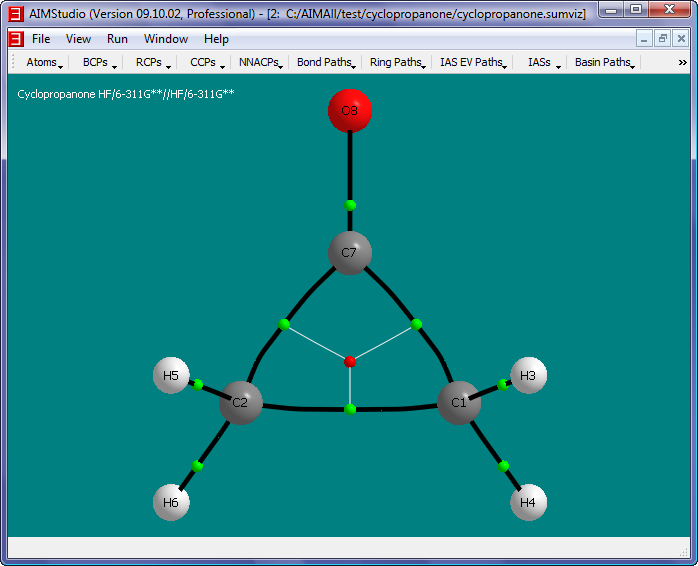
- Open the cyclopropanone.sumviz file generated in Tutorial 1.
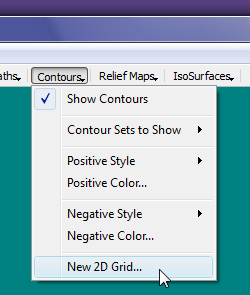
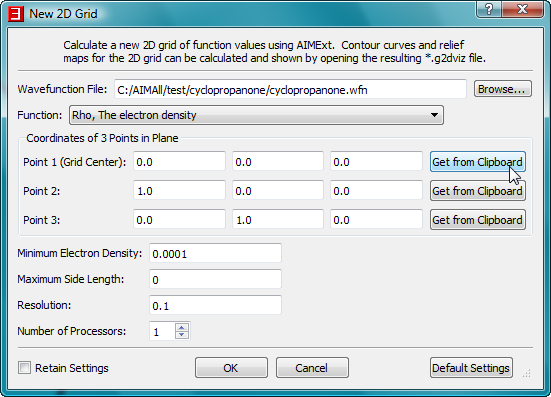
- Select the menu item "Relief Maps->New 2D Grid" to launch a "New 2D Grid" dialog.

- In the "New 2D Grid" dialog, select the "Browse" button to launch a file open dialog and select the file C:\AIMAll\test\cyclopropanone\cyclopropanone.wfn.
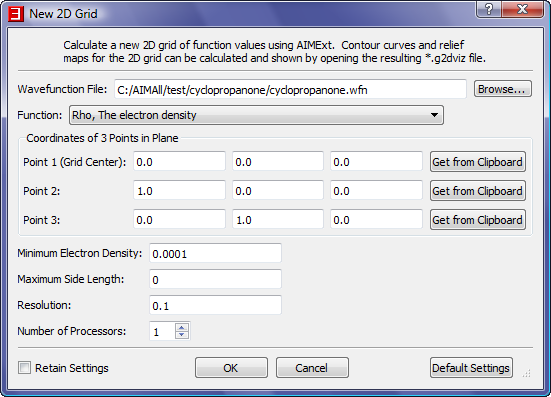
- We need to specify a plane for the 2D grid and we can do so by specifying 3 points in the plane. We are interested in the ring plane so we will use the 3 carbon nuclei for the 3 points.
- In the window showing the cyclopropanone.sumviz file, right-click on the C1 nuclear sphere to popup a context menu. Select the menu item "Copy Coordinates
of Atom C1 to clipboard".
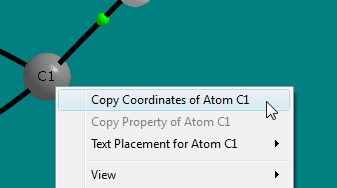
- In the "New 2D Grid" dialog, click on the "Get From Clipboard" button for Point 1
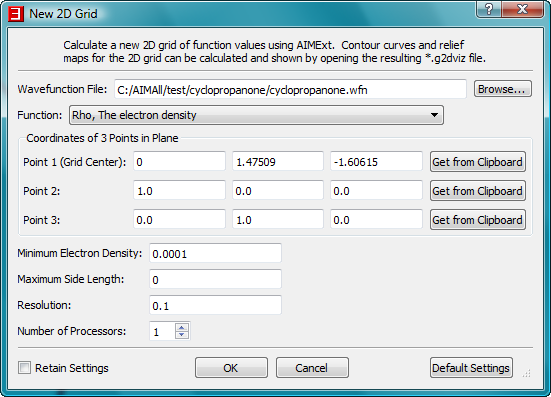
- In the same way, copy the coordinates of atom C2 to point 2 and the coordinates of atom C7 to point 3.
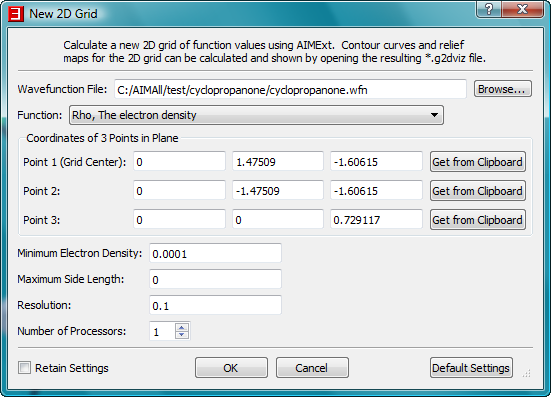
- Click the "OK" button in the "New 2D Grid" dialog to begin the AIMExt calculation of the electron density grid. A console window for AIMExt will
briefly appear.
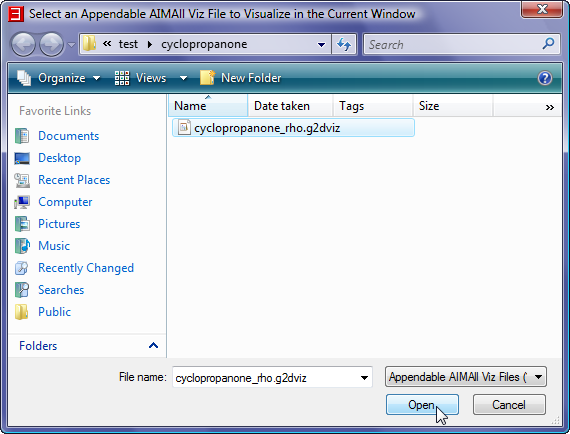
- In AIMStudio, select the menu item "File->Open in Current Window" to launch a File Open dialog and open the file C:\AIMAll\test\cyclopropanone\cyclopropanon_rho.g2dviz
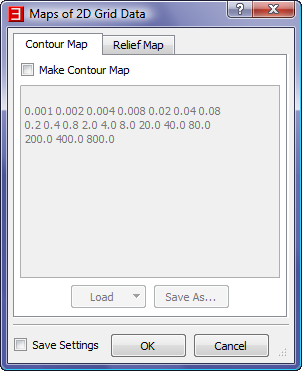
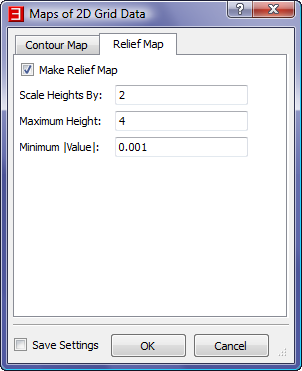
- In the "Maps of 2D Grid Data" dialog, uncheck the "Make Contour Map" box in
the "Contour map" tab, edit the fields in the "Make Relief Map" tab as shown below and then click "OK".
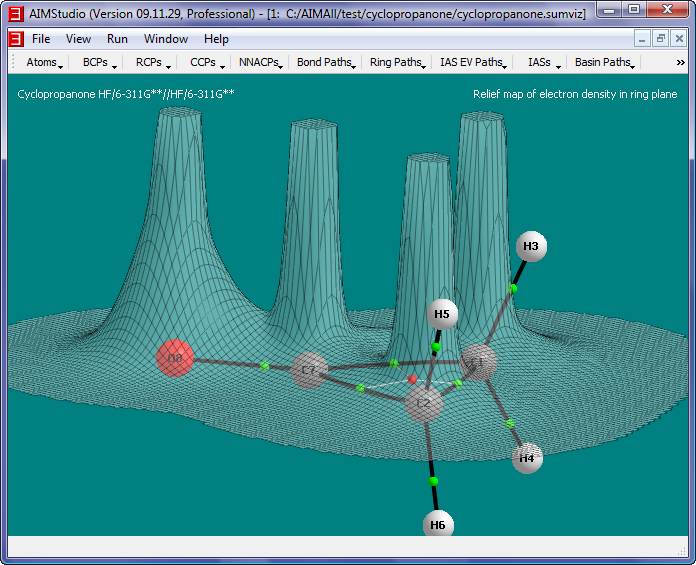
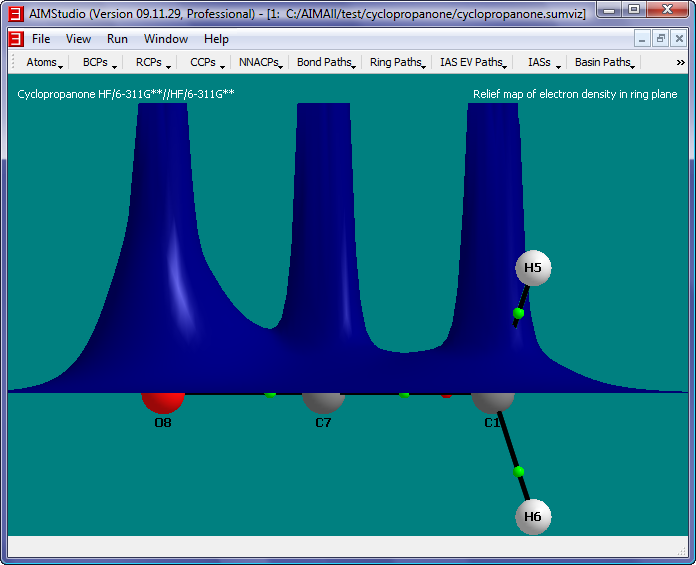
The solid, non-transparent blue map was achieved by setting the Relief Map Outline Style to None and by setting the Relief Map Fill color to blue with no transparency (alpha channel value of 255 in the color dialog).
- Repeat step 2-8, except in the "New 2D Grid" dialog, choose "The Laplacian of the Electon Density, DelSqRho" for the Function, use 0.05 for
the grid resolution and open the file "C:\AIMAll\test\cyclopropanone\cyclopropanone_delsqrho.g2dviz
- In the "Maps of 2D Grid Data" dialog, specify 1, 7 and 0.001 for the Relief Map parameters.
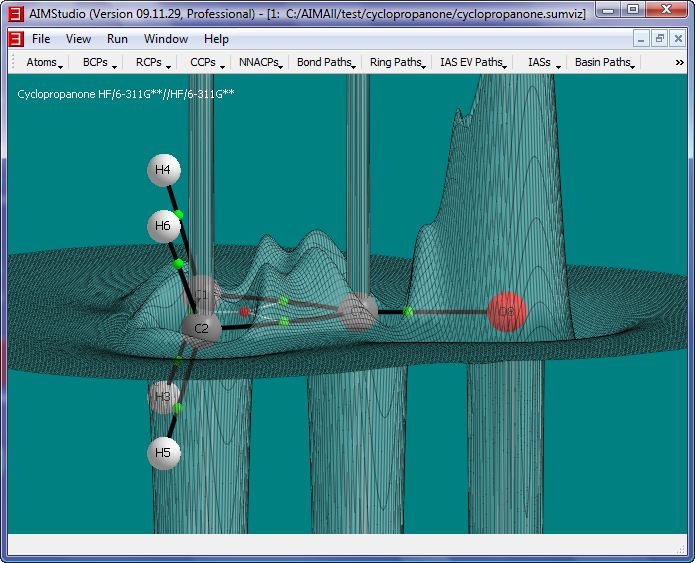
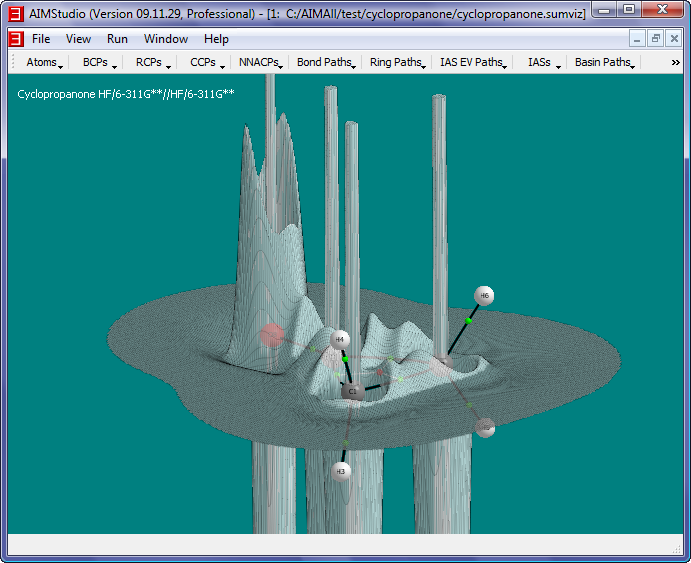
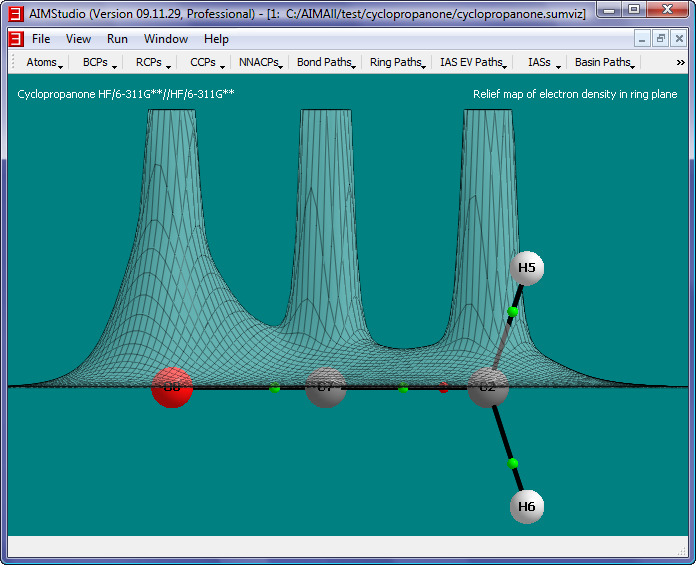
The relief map of the Laplacian of the electron density shows peaks of charge concentration (negative Laplacian) for the covalent C-C bonds but charge depletion (positive Laplacian) for the polar C-O bond. The maps
also show maxima in the negative Laplacian on either side of the oxygen atom, corresponding to the lone pair model.
Copyright © by Todd A. Keith, 1997-2014 (aim@tkgristmill.com)