 Manual for AIMAll (Version 14.11.23)
Tutorial 8 - Contour Maps
This tutorial shows some ways to generate and display contour maps using AIMStudio.
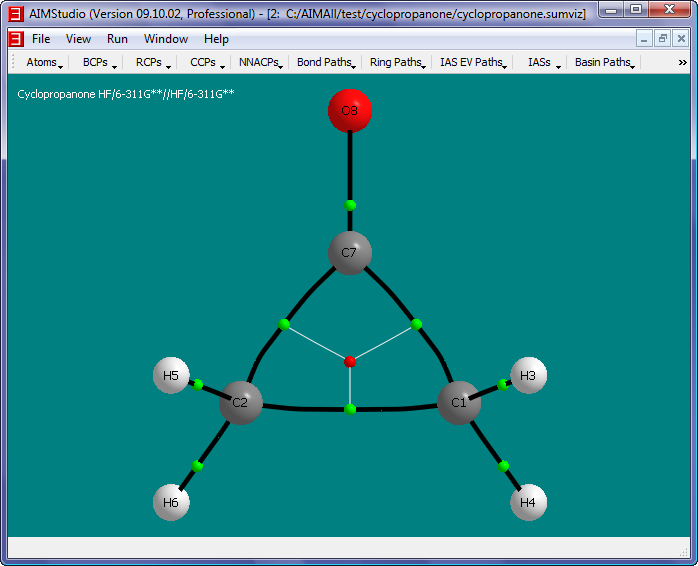
- Open the cyclopropanone.sumviz file generated in Tutorial 1.
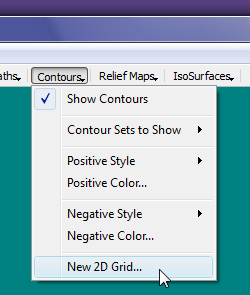
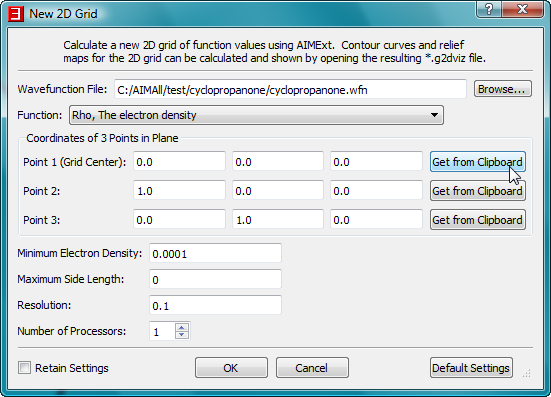
- Select the menu item "Contours->New 2D Grid" to launch a "New 2D Grid" dialog.

- In the "New 2D Grid" dialog, select the "Browse" button to launch a file open dialog and select the file C:\AIMAll\test\cyclopropanone\cyclopropanone.wfn.
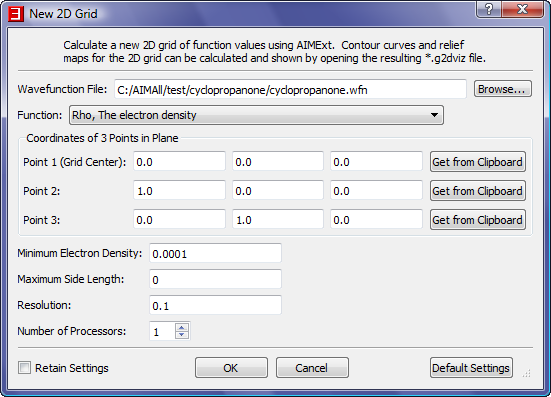
- We need to specify a plane for the 2D grid and we can do so by specifying 3 points in the plane. We are interested in the ring plane so we will use the 3 carbon nuclei for the 3 points.
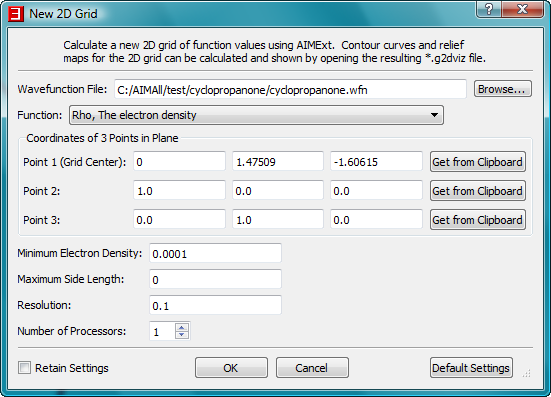
- In the window showing the cyclopropanone.sumviz file, right-click on the C1 nuclear sphere to popup a context menu. Select the menu item "Copy Coordinates
of Atom C1 to clipboard".
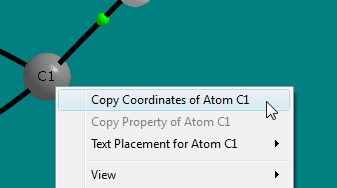
- In the "New 2D Grid" dialog, click on the "Get From Clipboard" button for Point 1
- In the same way, copy the coordinates of atom C2 to point 2 and the coordinates of atom C7 to point 3.
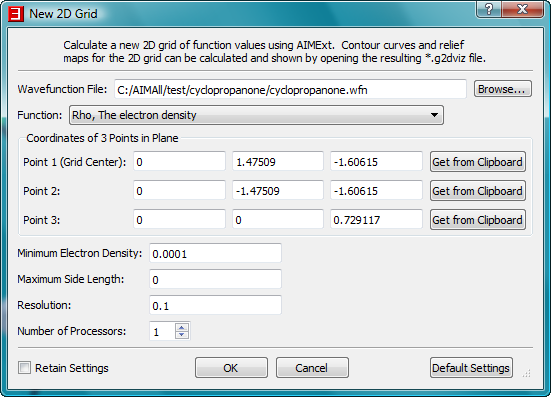
- Click the "OK" button in the "New 2D Grid" dialog to begin the AIMExt calculation of the electron density grid. A console window for AIMExt will
briefly appear.
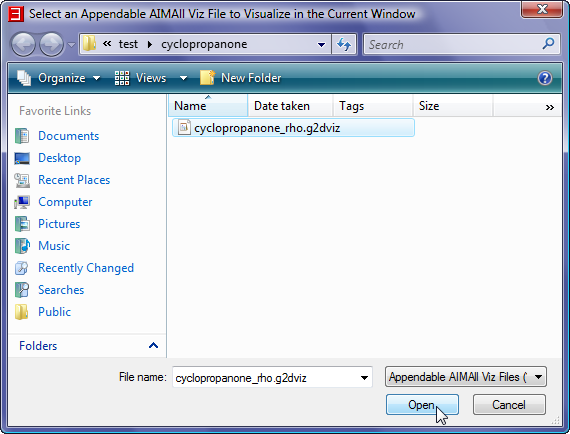
- In AIMStudio, select the menu item "File->Open in Current Window" to launch a File Open dialog and open the file C:\AIMAll\test\cyclopropanone\cyclopropanon_rho.g2dviz
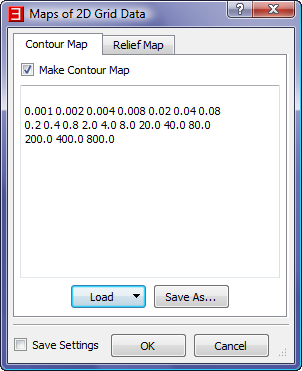
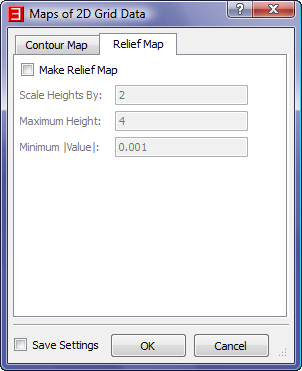
- In the "Maps of 2D Grid Data" dialog, accept the default values for the "Contour Map" tab, uncheck the "Make Relief Map" box in
the "Relief Map" tab and then click "OK".
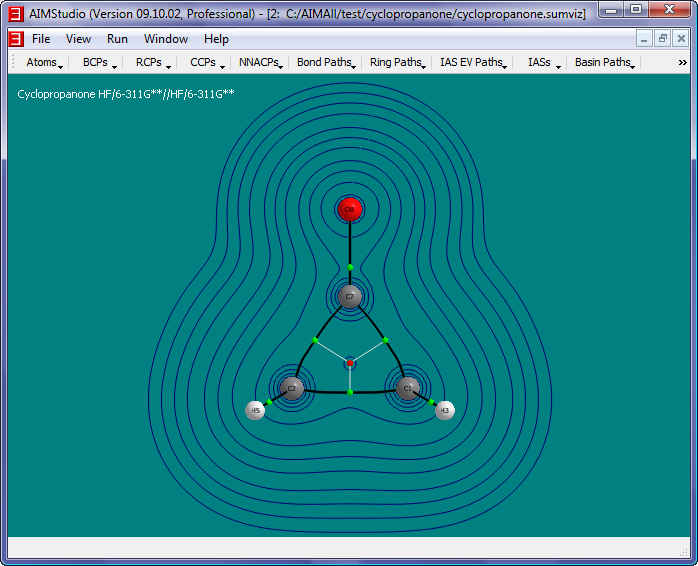
- Check the menu item "IAS EV Paths->Show IAS EV Paths" and then select the menu item "IAS EV Paths to Show" to show only the IAS EV Paths that lie in the
grid plane.
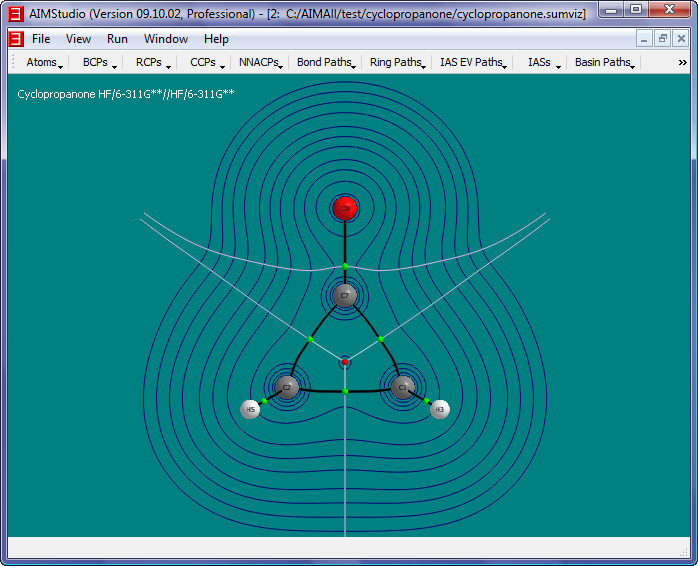
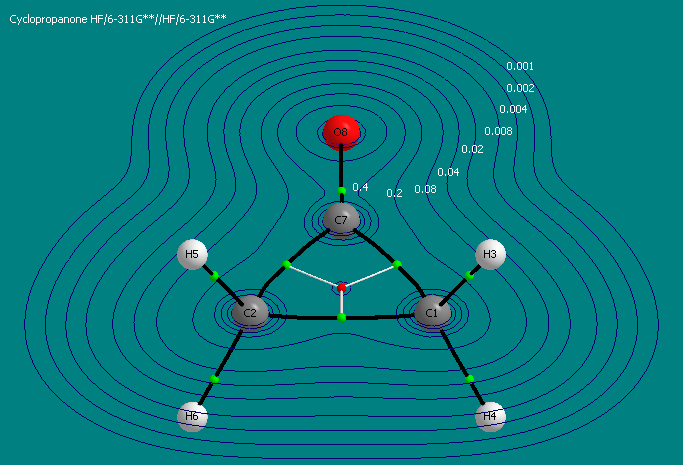
- The value of any contour can be displayed at any contour point by simply clicking there. To remove an existing contour label, simply click near the point again. To remove
all contour labels at once, select the "Contours->Text->Clear" menu item.
- Hide the Rho Contour map by unchecking the menu item "Contours->Contour Sets to Show->1. Rho"
- Repeat step 2-9, except in the "New 2D Grid" dialog, choose "The Laplacian of the Electon Density, DelSqRho" for the Function, use 0.05 for
the grid resolution and open the file "C:\AIMAll\test\cyclopropanone\cyclopropanone_delsqrho.g2dviz
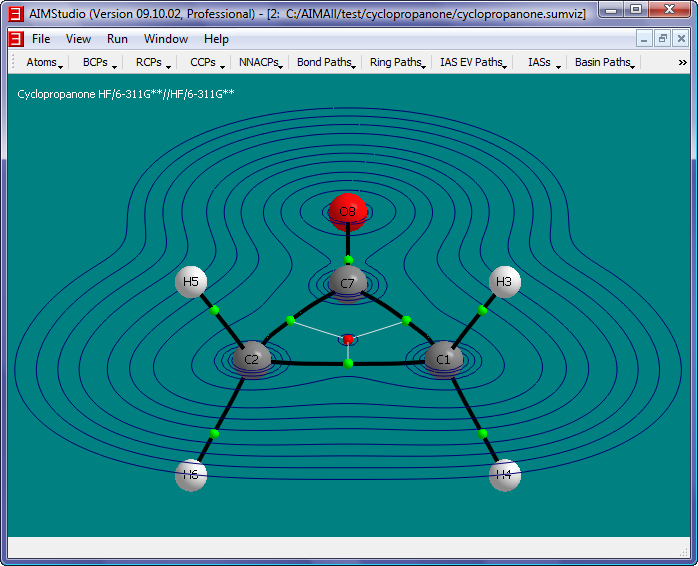
- Check the menu item "Atoms->Nuclear Style->Points" and select the menu item "View->Legend->Header Text..." to make the Legend read "Laplacian of Rho"
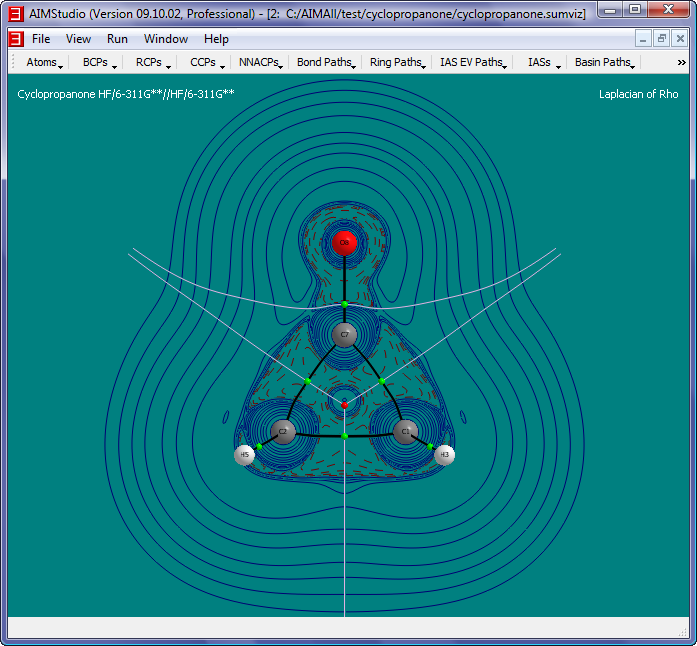
- Check the menu item "Contours->Negative Style->Solid Paths" and increase the brightness of the negative contour curve colors via "Contours->Negative Color..."
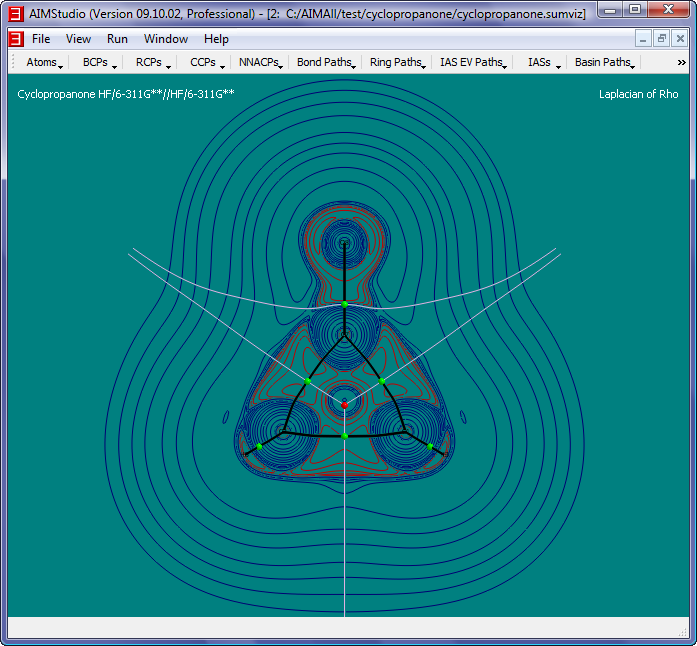
- Select "View->Background Color..." to change the background color to white and select "IAS EV Paths->Color..." to darken the color of the IAS EV paths. Also,
change the Title and Legend colors to black via the "View->Title->Font Color..." and "View->Legend->Font Color..." menu items.

Copyright © by Todd A. Keith, 1997-2014 (aim@tkgristmill.com)