QDateTimeAxis Class
The QDateTimeAxis class is used for manipulating chart's axis. More...
| Header: | #include <QDateTimeAxis> |
| Instantiated By: | DateTimeAxis |
| Inherits: | QAbstractAxis |
Properties
- 27 properties inherited from QAbstractAxis
- 1 property inherited from QObject
Public Functions
| QDateTimeAxis(QObject *parent = Q_NULLPTR) | |
| ~QDateTimeAxis() | |
| QString | format() const |
| QDateTime | max() const |
| QDateTime | min() const |
| void | setFormat(QString format) |
| void | setMax(QDateTime max) |
| void | setMin(QDateTime min) |
| void | setRange(QDateTime min, QDateTime max) |
| void | setTickCount(int count) |
| int | tickCount() const |
Reimplemented Public Functions
| virtual AxisType | type() const |
- 58 public functions inherited from QAbstractAxis
- 31 public functions inherited from QObject
Signals
| void | formatChanged(QString format) |
| void | maxChanged(QDateTime max) |
| void | minChanged(QDateTime min) |
| void | rangeChanged(QDateTime min, QDateTime max) |
| void | tickCountChanged(int tickCount) |
- 25 signals inherited from QAbstractAxis
- 2 signals inherited from QObject
Additional Inherited Members
- 1 public slot inherited from QObject
- 1 public variable inherited from QObject
- 10 static public members inherited from QObject
- 9 protected functions inherited from QObject
- 2 protected variables inherited from QObject
Detailed Description
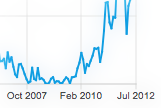
The QDateTimeAxis class is used for manipulating chart's axis.
The labels can be configured by setting an appropriate DateTime format. QDateTimeAxis works correctly with dates from 4714 BCE to 287396 CE. There are also other limitiation related to QDateTime. Please refer to QDateTime documentation. QDateTimeAxis can be setup to show axis line with tick marks, grid lines and shades.
Note: QDateTimeAxis is disabled on platforms that define qreal as float.

QDateTimeAxis can be used with any QXYSeries. To add a data point to the series QDateTime::toMSecsSinceEpoch() is used.
  QLineSeries *series = new QLineSeries;

  QDateTime xValue;
  xValue.setDate(QDate(2012, 1 , 18));
  xValue.setTime(QTime(9, 34));
  qreal yValue = 12;
  series->append(xValue.toMSecsSinceEpoch(), yValue);

  xValue.setDate(QDate(2013, 5 , 11));
  xValue.setTime(QTime(11, 14));
  qreal yValue = 22;
  series->append(xValue.toMSecsSinceEpoch(), yValue);
Adding the series to the chart and setting up the QDateTimeAxis.
  QChartView *chartView = new QChartView;
  chartView->chart()->addSeries(series);

  // ...
  QDateTimeAxis *axisX = new QDateTimeAxis;
  axisX->setFormat("dd-MM-yyyy h:mm");
  chartView->chart()->setAxisX(axisX, series);
Property Documentation
format : QString
The format string that is used when creating label for the axis out of a QDateTime object. Check QDateTime documentation for information on how the string should be defined.
Access functions:
| QString | format() const |
| void | setFormat(QString format) |
Notifier signal:
| void | formatChanged(QString format) |
See also QChart::locale.
max : QDateTime
Defines the maximum value on the axis. When setting this property the min is adjusted if necessary, to ensure that the range remains valid.
Access functions:
| QDateTime | max() const |
| void | setMax(QDateTime max) |
Notifier signal:
| void | maxChanged(QDateTime max) |
min : QDateTime
Defines the minimum value on the axis. When setting this property the max is adjusted if necessary, to ensure that the range remains valid.
Access functions:
| QDateTime | min() const |
| void | setMin(QDateTime min) |
Notifier signal:
| void | minChanged(QDateTime min) |
tickCount : int
The number of tick marks for the axis.
Access functions:
| int | tickCount() const |
| void | setTickCount(int count) |
Notifier signal:
| void | tickCountChanged(int tickCount) |
Member Function Documentation
QDateTimeAxis::QDateTimeAxis(QObject *parent = Q_NULLPTR)
Constructs an axis object which is a child of parent.
QDateTimeAxis::~QDateTimeAxis()
Destroys the object.
[signal] void QDateTimeAxis::formatChanged(QString format)
Axis emits signal when format of the axis has changed.
Note: Notifier signal for property format.
[signal] void QDateTimeAxis::maxChanged(QDateTime max)
Axis emits signal when max of axis has changed.
Note: Notifier signal for property max.
[signal] void QDateTimeAxis::minChanged(QDateTime min)
Axis emits signal when min of axis has changed.
Note: Notifier signal for property min.
[signal] void QDateTimeAxis::rangeChanged(QDateTime min, QDateTime max)
Axis emits signal when min or max of axis has changed.
void QDateTimeAxis::setRange(QDateTime min, QDateTime max)
Sets range from min to max on the axis. If min is greater than max then this function returns without making any changes.
void QDateTimeAxis::setTickCount(int count)
Sets count for ticks on the axis.
Note: Setter function for property tickCount.
See also tickCount().
int QDateTimeAxis::tickCount() const
Return number of ticks on the axis.
Note: Getter function for property tickCount.
See also setTickCount().
[signal] void QDateTimeAxis::tickCountChanged(int tickCount)
Axis emits signal when tickCount number on axis have changed.
Note: Notifier signal for property tickCount.
[virtual] AxisType QDateTimeAxis::type() const
Reimplemented from QAbstractAxis::type().
Returns the type of the axis.