ScatterSeries QML Type
The ScatterSeries type is used for making scatter charts. More...
| Import Statement: | import QtCharts 2.1 |
| Instantiates: | QScatterSeries |
| Inherits: |
Properties
- borderColor : color
- borderWidth : real
- brushFilename : QString
- markerShape : MarkerShape
- markerSize : real
Signals
- onBorderColorChanged(color color)
- onColorChanged(color color)
- onMarkerShapeChanged(MarkerShape shape)
- onMarkerSizeChanged(real size)
Detailed Description
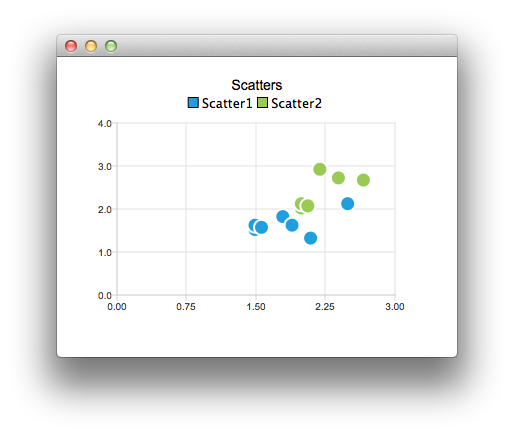
The following QML shows how to create a chart with two simple scatter series:
  ChartView {
      title: "Scatters"
      anchors.fill: parent
      antialiasing: true

      ScatterSeries {
          id: scatter1
          name: "Scatter1"
          XYPoint { x: 1.5; y: 1.5 }
          XYPoint { x: 1.5; y: 1.6 }
          XYPoint { x: 1.57; y: 1.55 }
          XYPoint { x: 1.8; y: 1.8 }
          XYPoint { x: 1.9; y: 1.6 }
          XYPoint { x: 2.1; y: 1.3 }
          XYPoint { x: 2.5; y: 2.1 }
      }

      ScatterSeries {
          name: "Scatter2"

Property Documentation
Defines the shape of the marker used to draw the points in the series. One of ScatterSeries ScatterSeries.MarkerShapeCircle or ScatterSeries.MarkerShapeRectangle. The default shape is ScatterSeries.MarkerShapeCircle.
Defines the size of the marker used to draw the points in the series. The default size is 15.0.
Signal Documentation
Signal is emitted when the marker shape has changed to shape.