PolarChartView QML Type
Polar chart element. More...
| Import Statement: | import QtCharts 2.1 |
Detailed Description
PolarChartView element is the parent that is responsible for showing different chart series types in a polar chart.
Polar charts support line, spline, area, and scatter series, and all axis types supported by those series.
Note: When setting ticks to an angular ValueAxis, keep in mind that the first and last tick are co-located at 0/360 degree angle.
Note: If the angular distance between two consecutive points in a series is more than 180 degrees, any line connecting the two points becomes meaningless, so choose the axis ranges accordingly when displaying line, spline, or area series.
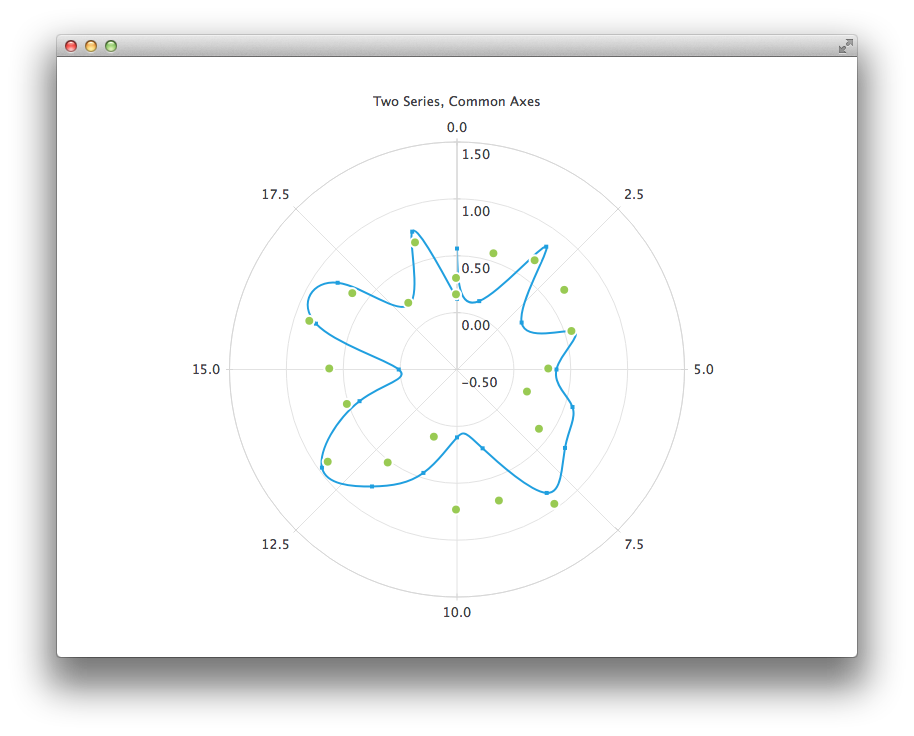
The following QML shows how to create a polar chart with two series:
  PolarChartView {
      title: "Two Series, Common Axes"
      anchors.fill: parent
      legend.visible: false
      antialiasing: true

      ValueAxis {
          id: axisAngular
          min: 0
          max: 20
          tickCount: 9
      }

      ValueAxis {
          id: axisRadial
          min: -0.5
          max: 1.5
      }

      SplineSeries {
          id: series1
          axisAngular: axisAngular
          axisRadial: axisRadial
          pointsVisible: true
      }

      ScatterSeries {
          id: series2
          axisAngular: axisAngular
          axisRadial: axisRadial
          markerSize: 10
      }
  }

  // Add data dynamically to the series
  Component.onCompleted: {
      for (var i = 0; i <= 20; i++) {
          series1.append(i, Math.random());
          series2.append(i, Math.random());
      }
  }